Introduction
Building footprint data is like a blueprint of the physical world around us. It captures the geometries and attributes of individual buildings, which gives us a detailed understanding of the structures that make up our cities and towns.
But their utility doesn't end there. These polygons often come packed with information about a building's height, purpose (commercial, residential), address, and sometimes even what it's built out of. The outcome: we can unlock a wealth of knowledge about a cityscape, model complex scenarios, and create impressive visualizations.
In today's digitally enabled world, building footprints are regarded as valuable assets across a variety of industries and projects! With new, innovative use cases popping up nearly every day.
Some of the most common application fields include telecommunications, insurance, urban planning, routing and navigation, local search and discovery, logistics, mobility, autonomous driving, and data visualization. They can also be used for augmented reality applications, merging the digital and physical worlds to deliver rich social, gaming, education, and productivity experiences.
In this article, we're going to take a deep dive into the nitty-gritty of creating building footprints for the built world around us. We'll cover the entire process – from obtaining elevation information to creating building polygons – and explore common use cases of building footprints to help you understand what's right for your project.
Ready to get started? Let's go!
Table of Contents:
- Understanding Building Footprints
- How to Create Building Footprints
- Choosing the Right Building Footprints for your Project
- Examples of Use Cases for Building Footprints
- Why use ONEGEO for Building Footprint data
- Conclusion & How to get started with Building Footprints
Understanding Building Footprints
As with all GIS data, building data comes in various formats (raster and vector), projections, and coordinate systems. Not to mention the diverse array of attributes that can make a building polygon come to life. So, regardless of whether you're looking for the most suitable dataset, or wanting to create your own building footprints, you'll need a solid understanding of these concepts to ensure your project's success. In this section, we'll dive into each of these concepts in more detail, and explain everything you need to know when working with building footprints.
Differences between Raster and Vector data for building footprints
Raster and vector data are two different ways of representing geographical data, and both have advantages and disadvantages when it comes to building footprints.
Raster data is made up of pixels, and is commonly used to store aerial or satellite imagery. Each pixel in a raster image represents a color or a value, and the image as a whole represents an area on the earth's surface. Raster data is good for displaying detailed images of an area, such as a city or a neighborhood, but it can be harder to extract specific information from the image.
![]()
Vector data, on the other hand, is made up of coordinates, lines, and polygons, and is commonly used to store geographic features like roads, buildings, and waterbodies. Each vector feature has its own set of attributes, like road names or building height, which can be used to extract specific information from the data. Vector data is good for displaying specific geographic features, but it may not be as detailed as raster data.

When it comes to building footprints, vector data is often considered the superior option. Building footprints are typically represented as polygons, which can easily be stored and displayed by vector data. Vector data also allows individual features to be linked with attributes, like building height and address, which can be useful for analysis and visualization.
Although raster data can also be used to represent building footprints, it may not be as accurate or detailed as vector data. You can read more about different data models and formats for 3D building data here.
In summary, while raster data is great for displaying detailed images, vector data reigns supreme when it comes to representing buildings with precision and storing the necessary attributes associated with building footprints.
Understanding the role of projections and coordinate systems of building footprints
Another aspect to consider when creating building footprints is the projection and coordinate system. The projection is a method for representing the earth's curved surface on a flat map, and different projections can result in varying levels of distortion. Coordinate systems, on the other hand, are used to assign specific geographic locations to different points on a map.
When working with building footprints, it's crucial to ensure that the projection and coordinate system are appropriate for the specific project and that all data is in the same system to avoid confusion and errors.
But how do you determine which system best aligns with your project needs? Here are the top four considerations to keep in mind:
- The scope and intent of your project. Different projections are more suitable for different areas and purposes. A local projection is ideal for small-scale mapping, while a global projection is best for large-scale mapping. So the best type of projection to use depends on the scope and intent of your project.
- The accuracy and precision required. Some projections are designed to minimize distortion in certain areas, while others prioritize overall accuracy. Similarly, certain coordinate systems are more precise than others. To choose what's best for your project, consider the accuracy and precision required.
- The software and tools being used. When it comes to creating building footprints, compatibility is key. That's why it pays to choose a projection and coordinate system that play well with the tools in your tech stack. Avoid any potential hiccups by choosing a system that is supported by your software and tools.
- The data sources being used. Lastly, you'll want to ensure that all data sources are in the same projection and coordinate system, or that they can be easily converted. That way, you can avoid the headache of compatibility issues upfront.
As a general rule of thumb, we'd recommend using a standardized projection and coordinate system, such as WGS84, to ensure consistency and compatibility across different data sources and tools. However, if your project requires different systems and projections, follow the tips above to ensure a smooth and efficient process.
Geometries and attributes of building footprints
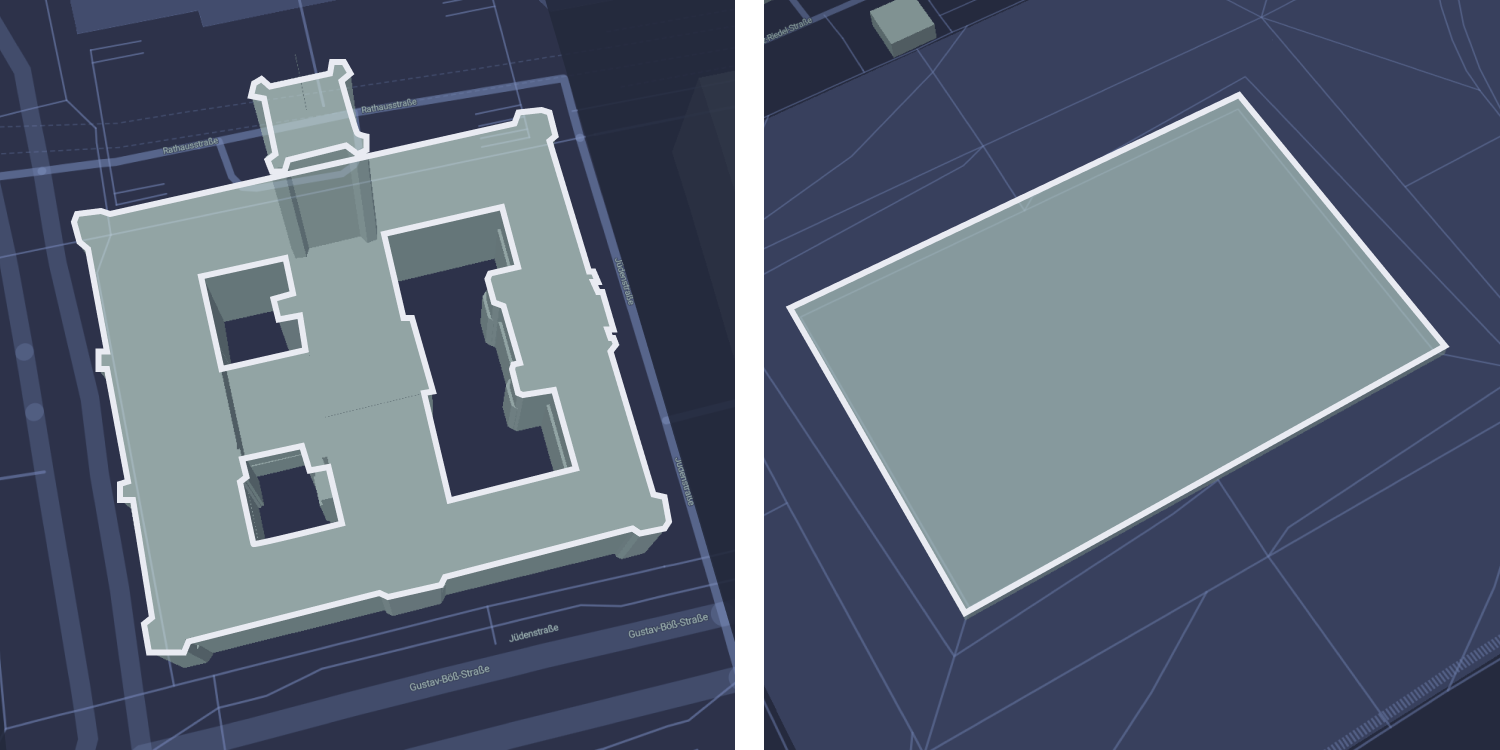
In terms of geometry, building footprints are typically represented by simple or complex polygons. These polygons are defined by a set of corner points or vertices that connect to form the shape of the building. While simple polygons are generally rectangles, more complex polygons may be used to represent round buildings, or features like an inner courtyard requiring inner polygons. These can be tricky to define and represent in building footprint data.
When it comes to attributes, building footprint data can be as simple as just the footprint itself or it can include additional information like building height, addresses, or even cladding material. One of the biggest downfalls of freely available open building data is its tendency to have missing or incomplete attributes. So even if you find the right coverage for your area of interest, you might not get all the rich attributes you need for your project. We'll dive deeper into how you can choose the right data for your project in a bit, but for now, simply keep in mind that not all data contains the same attributes, and which attributes are relevant for you depends entirely on the specific needs of your project.
Key Takeaway:
To succeed with building footprints, understand the difference between raster and vector data and
choose vector for more accurate building shape representation. Also, ensure the projection and coordinate system are
standardized for easy integration and comparison with other datasets.
How to Create Building Footprints
Creating building footprints is a two-step process - obtaining elevation information and crafting building polygons. In the following sections, we'll take a closer look at each of these steps.
Obtaining Elevation Information
To create accurate and detailed representations of buildings, the first thing you need to do is obtain elevation information. This is typically collected using Synthetic Aperture Radar (SAR), Light Detection and Ranging (LiDAR) and other surveying techniques, and stored in raster format. So the first step is finding a suitable elevation dataset.
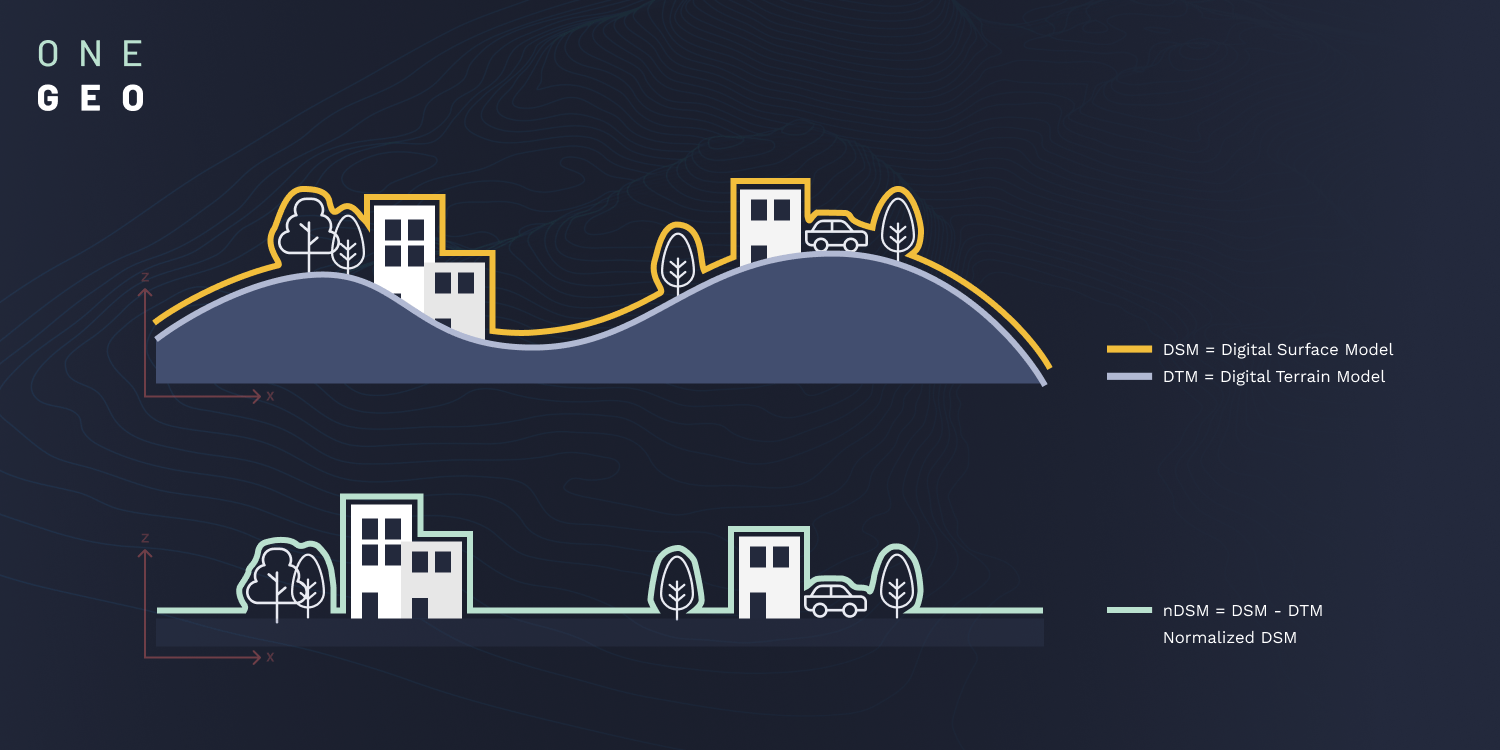
Once you've obtained a suitable elevation dataset - let's take LiDAR, for example - you can start by extracting two types of elevation data: Digital Terrain Models (DTM), and Digital Surface Models (DSM). As the name implies, DTMs represent the Earth's terrain - or bare rock surface. Whereas DSMs capture the top most surface of the Earth, including natural and man made features.
Once you've obtained the DTM and DSM for a study area, the next step is calculating the difference between them to create a Normalized DSM, or NDSM. This new raster gives you the relative height of features in relation to the surrounding ground level. Usually with a ground resolution of 1m or more.
To go from NDSM to building heights, you'll need to overlay the NDSM layer with your building polygon layer, and look at the median height value of all pixels that fall within each building polygon. You can then assign the median value to each respective building as the height property.
Side note: Although building height and building elevation are sometimes confused, they are not the same thing! Much like other elevation references, building elevation refers to the elevation of the building's surface relative to mean sea level. Building height, on the other hand, refers to the height of the building relative to the ground on which it's built.
For your polygon layer, you can either use a dataset with existing building footprints, or you can vectorize raster data to create new building polygons. Let's take a look at how you can go about creating building polygons from scratch.
Creating Building Polygons
There are several ways to create building polygons from scratch. Like manual digitization or vectorizing raster data from various sources, including aerial imagery, satellite imagery, or LiDAR data. Each source has its own advantages and limitations . So it pays to consider your project requirements before deciding which source to work with.
Once you're clear on the best data source, and you've obtained an appropriate data set, you can create your building footprints. Therefore, you'll need to convert the pixel-based raster data into vector data that can be represented by points, lines, and polygons. You can do this in any GIS software that has the capability to vectorize raster data.
Once you have your building polygons, it's time to enrich them with the relevant attributes. This can include information like the building height, street address, number of floors, building material, and year of construction. You might also include information about the building's use, or indicate whether it is residential or commercial. Again, the attributes you choose to include will depend on your specific project needs.
Choosing the Right Building Data for Your Project
Although it might seem like most building data is created equal, that's certainly not the case. Each provider and platform is unique, and the quality of datasets can vary greatly depending on the extent to which they're cleaned, checked, and augmented with additional attributes. So, when it comes to choosing the right building data for your project, there are several things to consider.
After working with building data for over 11 years, we've learned what to look out for when choosing the right data to match your needs. Our four top considerations are data coverage, accuracy, freshness, and complexity.
Let's break them down one by one.
- Coverage. This refers to the extent of your study area covered by the dataset. Some datasets only cover certain geographies or building types, which might not be fit for your purpose. That's why it pays to choose data that covers the (whole) area you're working on. Otherwise, you may find yourself with gaps in your information.
- Accuracy. Not all building data is accurate and precise, nor does it have to be. For some projects, approximate building locations are more than enough, while other projects require precise locations and a more granular representation of distinct features. When choosing the right data and provider, consider the degree of accuracy you need to give your project a solid foundation.
- Freshness. As the built world around us keeps changing, you can quickly find yourself with outdated building data. That's why it's important to evaluate data recency and update frequency in the context of your project needs. By working with the latest data available, you can ensure that any analysis or visualizations you produce are up to date.
- Complexity. This refers to the level of detail in the data. When working with building footprints, you'll want to ensure that the data is detailed enough to meet the needs of your project. That way, you'll have the necessary information to carry out your analysis or visualizations.
As you consider these factors, always bear in mind your project needs. Do you need detailed information about building heights? Are you focusing on a small or large area of interest? Is it crucial to have access to the latest information? Which level of detail do you need?
Your answers to these questions (and more) will dictate the appropriate data coverage, accuracy, freshness, and complexity. For example, if you're working on a project that requires detailed information about building heights because you're designing a flight path, you'll want to ensure that the data you choose includes accurate, comprehensive, and up to date height information. Whereas if you're looking at ground level routing or navigation, having up to date height information might be less relevant.
Overall, by keeping these considerations in mind, you'll be able to choose the right building footprint data for your project and ensure accurate and reliable results.
Key Takeaway:
When choosing the right building footprint data for a project, consider coverage, accuracy,
freshness, complexity and the specific needs of the project. It is also important to keep in mind the format of the
data and ensure it can be easily integrated and used in the project.
Examples of Use Cases for Building Footprints
Building footprints have a wide range of use cases across various industries. Here are just a few examples of how building footprints can be used in different sectors and industries to improve decision making and operations.
Energy
A common use case for building footprints is analyzing opportunities for solar panel placement and energy savings. By understanding building height, roof orientation, and shading, energy companies can optimize the placement of solar panels and predict energy output. Additionally, building footprints and materials can be used to identify energy-efficient buildings so they can target retrofitting efforts for maximum impact.
Telecommunication
Network infrastructure planning is another key use case for building footprints. By understanding the layout and height of buildings, telecommunications companies can determine the best placement of cell towers and other network infrastructure. This information is also crucial for predicting coverage and identifying areas that may require additional infrastructure.

Insurance
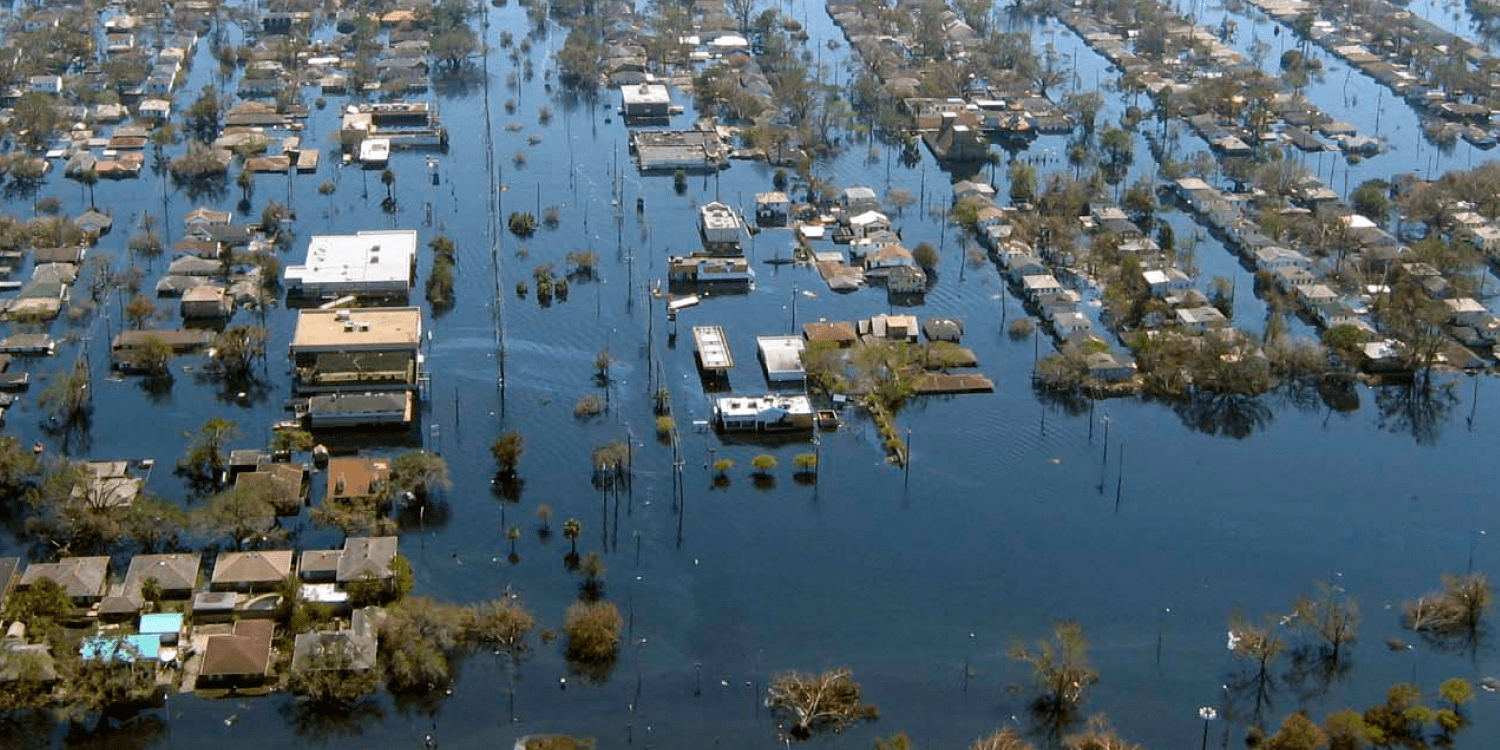
Building footprints are particularly useful for co-tenancy and adjacency risk assessment in the insurance industry. By having detailed information on the location and layout of buildings, insurance companies can predict and mitigate risks associated with natural disasters and other hazards. They can also assess the risk of damage to nearby buildings in the event of an incident.
Urban Planning
In urban planning, building footprints can be used for a variety of purposes, including traffic planning and livability assessments. By understanding the layout of buildings and the location of key amenities, urban planners can identify areas where traffic congestion, noise pollution, or shading are likely to occur and take steps to mitigate their impact. They can also identify areas that may require additional amenities or services to improve livability.

Navigation
Navigation is another use case for building footprints, where they're commonly used as landmarks or to improve a system's UX. By having detailed information on the shape, size, and location of buildings, navigation systems can provide more accurate directions and help users orient themselves in unfamiliar areas. This is particularly useful for pedestrians and drivers in urban environments.

Why use ONEGEO for Building Data
At ONEGEO, we understand that one of the biggest challenges when it comes to building footprint data is the time and effort it takes to search for and check data sources. ONEGEO eliminates this problem by doing all the heavy lifting for you, so you can rest assured that you are getting the most accurate and relevant data in a ready-to-use format.
Discover the ease and convenience of accessing top-notch building footprint data with our comprehensive and standardized solution. By choosing us, you can:
- Save time and resources
- Be confident in the data accuracy and relevance
- Avoid potential legal issues and data use implications
- Benefit from the combination of different data sources
- Stop worrying about data conversion and formatting
- Effortlessly integrate our data with through a standardized format
- Rely on comprehensive support if and when you need it
In essence, when you choose ONEGEO, you're choosing to save time and make better decisions with the right building data. So why not give us a try and see the difference for yourself?
Conclusion & How to get Started with Building Footprints
If you're ready to take the next step and get started with building footprints, ONEGEO is here to help. We make it easy, safe, and convenient to get the data you need. To get started, simply get your $50 coupon code. With this, you can download and try some of our data for free, allowing you to experience the benefits of building footprints for yourself. Don't let poor data hold you back any longer, take the first step towards better decisions with ONEGEO.
Building footprints are a valuable asset in today's digitally enabled world. As digital replicas of our cities and towns, they provide a wealth of information that can be used to gain valuable insights and improve decision making across diverse sectors and industries. In this article, we have covered everything you need to know about building footprints, including an overview of what they are, how to create them, and how to choose the right data for your project.
No matter how you plan to use them, building footprints are a rich data source that can add valuable context to your project.