Introduction
When it comes to representing the physical world around us, geospatial data and 3D building data are two of the most common options. They play a crucial role across various industries and projects. From building digital twins to visualizing cityscapes and creating immersive applications.
But despite their similarities, geospatial and 3D building data are not interchangeable.
While geospatial data describes the physical characteristics of a location, like its shape, size, and elevation, 3D building data can be more complex. It includes not only the physical characteristics of a location but also detailed representations of the buildings within it. This type of data can be used to create realistic 3D models of buildings and other structures in a given area. 3D building data is often more independent of its context because the data could be anywhere in space, but it can be geo-referenced. Geographical data, on the other hand, through its real world coordinates and projection is always in the context of where it is located and is therefore easier to connect with other nearby features.
In this article, we will explore the unique properties of geospatial and 3D building data, and outline what to consider when choosing the right format for your project.
Let's dive in.
Table of Contents
- Geospatial Data
- 3D Building Data
- Combining Geospatial and 3D data
- Choosing the Right Data Format
- Conclusion
Geospatial Data
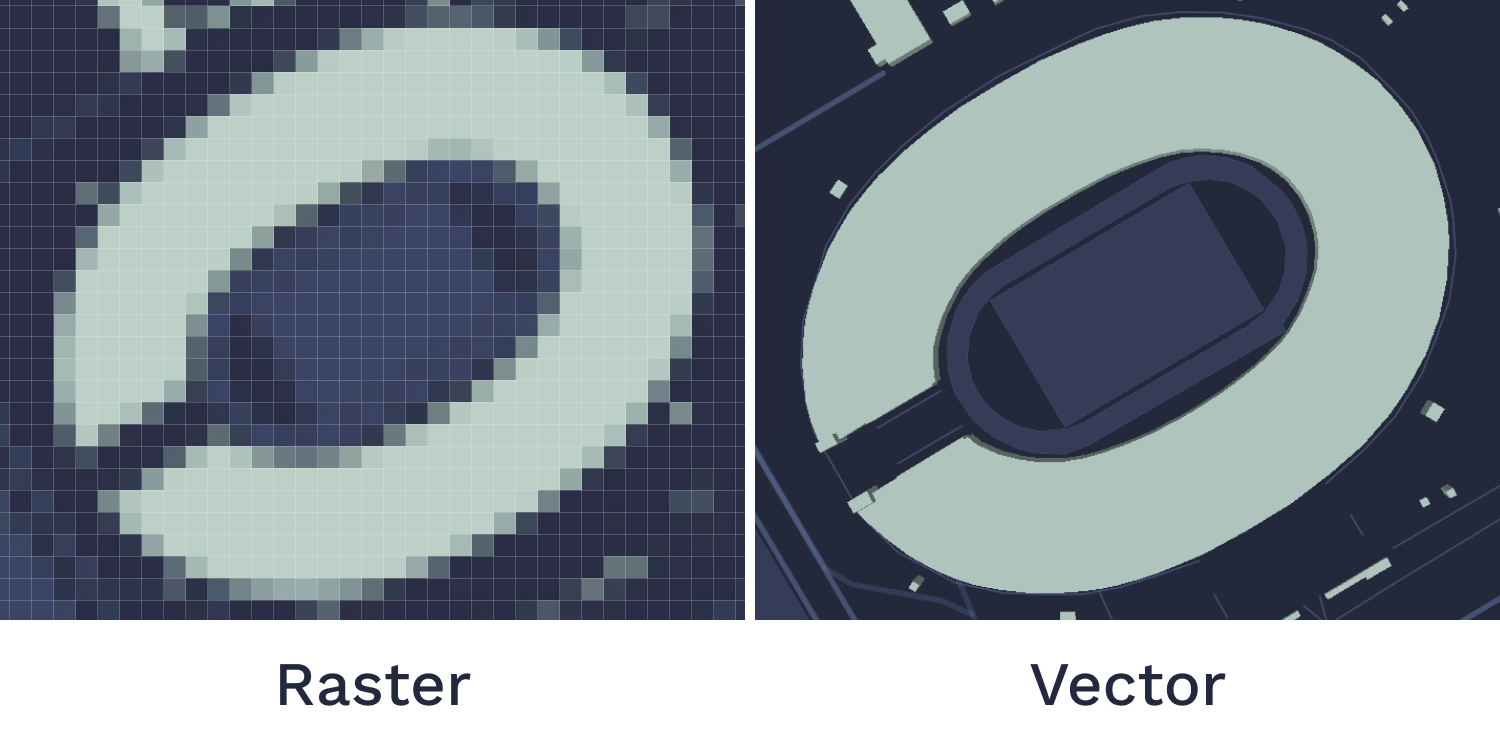
There are two main types of geospatial data: Raster data and vector data. Both formats are anchored to a specific location on the Earth's surface and represent features or surfaces, typically in a flat plane (2-dimensional). However, you can extract building height information from raster surfaces, like DTM/DSM data, and add it to vector data to create 3D representations. (You can read more about the exact process here.) This allows you to generate 3D building footprints that you can use for various applications from urban planning to navigation and more!
The main benefit of geospatial data is that it is anchored to a precise location on Earth and may provide additional attribute data. It is, therefore, useful if you're looking to analyze a specific project area in the real world. The most common file formats are Shapefiles, GeoJSON, and GPKG.
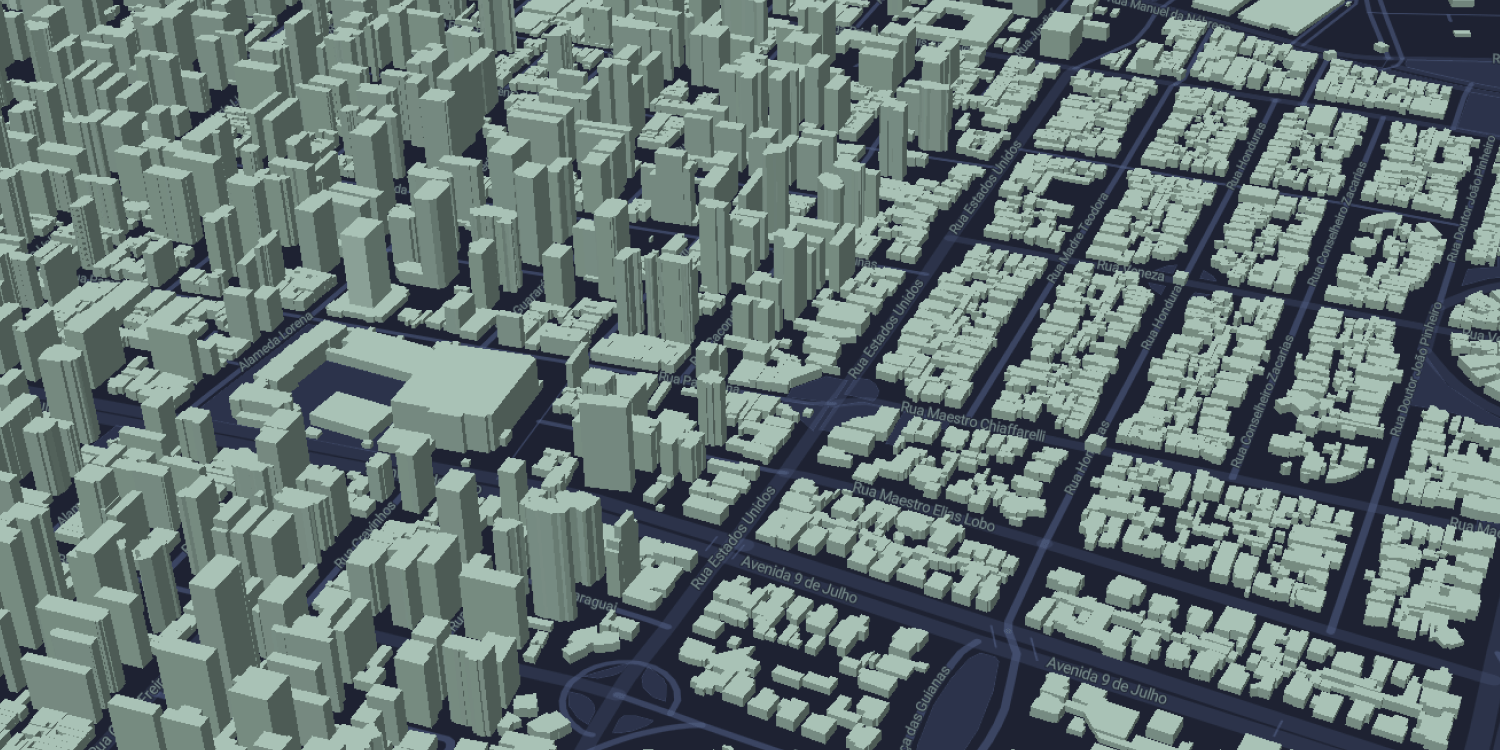
Whether you're using typical 2D geospatial data or its 3-dimensional counterpart with added height information, you can conduct highly accurate spatial analyses, create maps, and visualize features like roads, rivers, and building footprints.
However, geospatial data also has its limitations. Although it can easily be placed on a map and analyzed in a GIS, it often doesn't contain the same detailed view of buildings as 3D building data. Therefore, it may be less suitable for projects that rely on detailed visualizations, like virtual tours or simulations requiring highly accurate representations of built environments.
Key Takeaway:
Geospatial data is anchored to a precise location on Earth and often includes additional attribute information.
Geospatial data is typically 2D, but it can be turned into a 3D representation, e.g. by adding height information to building footprints.
While this gives you a simplified view of the built environment, it is the better choice for analysis due to its geolocation and attribute data.
3D Building Data
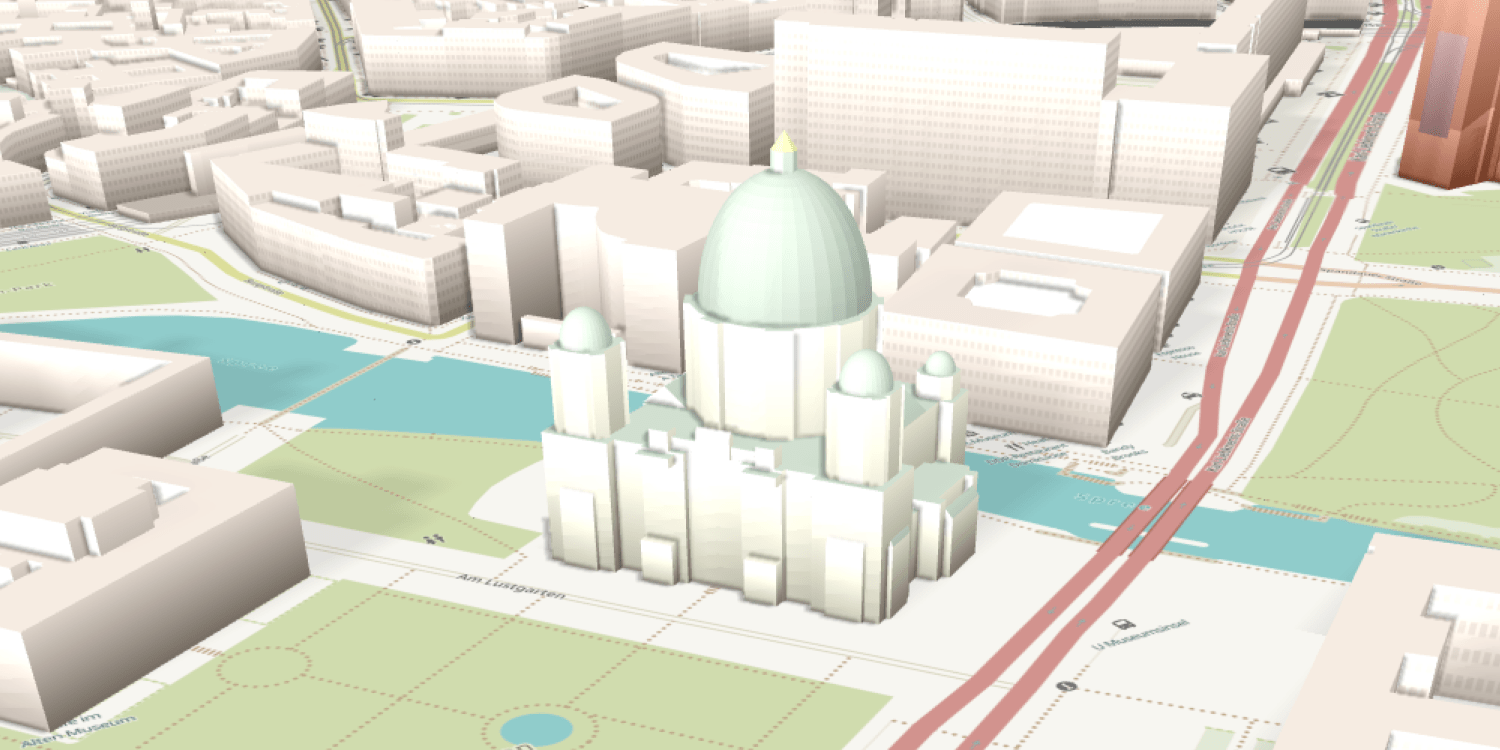
3D building data is a digital representation of buildings' physical characteristics and attributes in three-dimensional space. This includes details such as roof shape, wall height, window size, door locations, materials used in construction (e.g., brick), and more. These comprehensive attributes give 3D building data its complexity and the ability to depict complex shapes and objects such as spheres and irregularly shaped buildings.
The level of accuracy depends on the source from which the 3D building data was acquired; some sources may provide only basic outlines, while others offer high-resolution models with precise measurements down to centimeters or even millimeters.
Because pure 3D data is not designed to store geographic information, it cannot be automatically positioned on a map like geospatial data. 3D buildings are generally used in 3D graphics such as in animations in movies or video games where the geographical context is less important. To display pure 3D data on a map, it needs to be transformed into a format that contains geographic information, such as KML, or into a geospatial format, such as a shapefile, before it can be positioned and visualized. Another option is to keep the data in a specific 3D format and add the geo-location data to it, including latitude, longitude, rotation and scale, such as in Sketchup or BIM applications.
Pure 3D data formats allow for the creation of complex shapes such as spheres by representing objects in a 3-dimensional coordinate system. In these formats, each point in the object is defined by its X, Y, and Z coordinates, which describe its position in 3D space. Complex shapes can be created by defining multiple points and connecting them in specific ways. Certain 3D data formats, such as OBJ, Collada, and GLTF also allow for the specification of surface normals and texture coordinates, which provide additional information about the appearance and behavior of the object in a 3D environment.
Key Takeaway:
Pure 3D data can be used to represent complex shapes, including spheres, but it is not anchored to a specific location on Earth
and can be difficult to place on a map. It is commonly used in gaming and movies to create immersive experiences but is less suitable for analysis
in real-world projects.
Combining Geospatial and 3D Data
By combining geospatial and 3D building data, you can take advantage of each data type's strengths and create 3D models with accurate geographic location information.
With technological advancements, it has become possible to merge geospatial and 3D data to create interactive and realistic 3D environments that can be used in various applications such as video games, virtual tours, and city planning simulations.
These models can then be used in video games, movies, and virtual tours, creating a more engaging and interactive user experience. This convergence of geospatial and 3D data drives innovation in both the geovisualization and gaming industries and leads to more dynamic and interactive user experiences.
Let's take a closer look at each of these data formats:
- KML (Keyhole Markup Language) is a file format that displays geospatial data in Google Earth, Google Maps, and other geospatial-based applications. It allows you to create 3D models and visualizations but is primarily used for its geospatial properties, such as its ability to define locations and boundaries on a map.
- Collada (COLLAborative Design Activity) is an XML-based file format commonly used to transfer 3D assets between digital content creation tools and interactive applications. It can also include geospatial information, such as location data and altitude, allowing you to place 3D models on a map.
- GLTF (GL Transmission Format) is a file format for 3D scenes and models widely used in the web and gaming industries. Like Collada, it can also include geospatial information, allowing you to place 3D models on a map. It is a compact and efficient format for delivering 3D content and is widely supported by various game engines and tools.
In essence, these formats bring the best of both worlds together by allowing users to create rich, interactive 3D visualizations while also incorporating geospatial data for placement on a map.

Key Takeaway:
Combining geospatial and 3D data using formats such as KML, Collada, and GLTF brings together the best of both worlds by allowing you to
create interactive 3D visualizations while incorporating geospatial data for placement on a map.
Choosing the Right Data Format
When it comes to choosing between geospatial and 3D building data for a project, there are several factors to consider. The first is the specific needs of the project. Geospatial data is great for storing clickable footprints and attributes, which is useful for analysis. On the other hand, 3D building data allows users to create complex shapes and realistic visualizations of cityscapes or landscapes. 3D building data is typically used in games and movies to create realistic visualizations and immersive experiences.
If your project requires analysis and visualization, you might consider working with both data types. For example, if you need to carry out accurate flight path analysis, you would be better served by detailed geospatial data with height attributes, as this gives you the most accurate data for analysis. But for presenting the analysis outcomes to your stakeholders, you could create a visualization using 3D building data to show a more realistic representation of the project.
Key Takeaway:
If you need to analyze large amounts of spatial information quickly and accurately, geospatial data is more suitable than 3D data,
which often requires additional processing time due to its complexity. However, if you're only dealing with a small dataset and need detailed visuals
on which to base decisions, then 3D data could provide more insight than traditional 2-dimensional maps created from geospatial datasets.
Considerations for Analysis
Geospatial data, which typically represents geographical information in two dimensions (latitude and longitude), can be turned into a 3D representation by adding height data to the building footprints. While the representations of buildings are simplified, it provides a way to view and analyze accurate geographical information more easily compared to pure 3D formats. Geospatial data has clickable footprints and attributes, allowing you to view attributes like height, address, and other information by clicking on the map. In contrast, pure 3D formats can be more challenging to analyze and may not provide the same level of detail as geospatial data. Geospatial data provides a way to view and analyze data at a high level and then drill down into more specific details, making it the better option for analysts looking to work with data.
Considerations for Visualization
If you're looking to create compelling visualizations, you may benefit from using 3D data because it enables more complex and immersive visual experiences and highly-detailed models that bring designs to life. The structure of 3D data makes it possible to create objects and shapes that can be viewed from all angles and perspectives, including spherical shapes like planets, terrain, and organic shapes. In contrast, geospatial data is typically limited to 2D representations with height information added to create a 3D scene, and does not offer the same level of visual detail and complexity.
Ultimately, the choice between geospatial and 3D building data will depend on the project's needs and target audience. Understanding these factors helps you make an informed decision that will save time and ensure better decisions with the right building data.

Conclusion
In conclusion, geospatial data and 3D data are two distinct types of data that have different strengths and weaknesses when it comes to analyzing and visualizing information. Geospatial data is typically 2D but can be used to create 3D representations by adding height information. Analysts often prefer this type of data for its ability to provide clickable footprints and attributes. On the other hand, pure 3D data formats are more suited for visualizations that require complex shapes, such as spheres. They are commonly used in the gaming and movie industries but cannot be placed on a map. Formats like KML, Collada, and GLTF combine the strengths of geospatial and 3D data by including geospatial information and 3D shapes in a single file.
Overall, understanding the differences between geospatial and 3D data is critical to making informed decisions about best representing information. Whether you're looking to create a detailed map or a stunning visual representation, having a deep understanding of these two data formats will help you make the best choice for your needs.
If you'd like to give it a go and see how you can start using 3D building data on your projects, get your $50 coupon here.